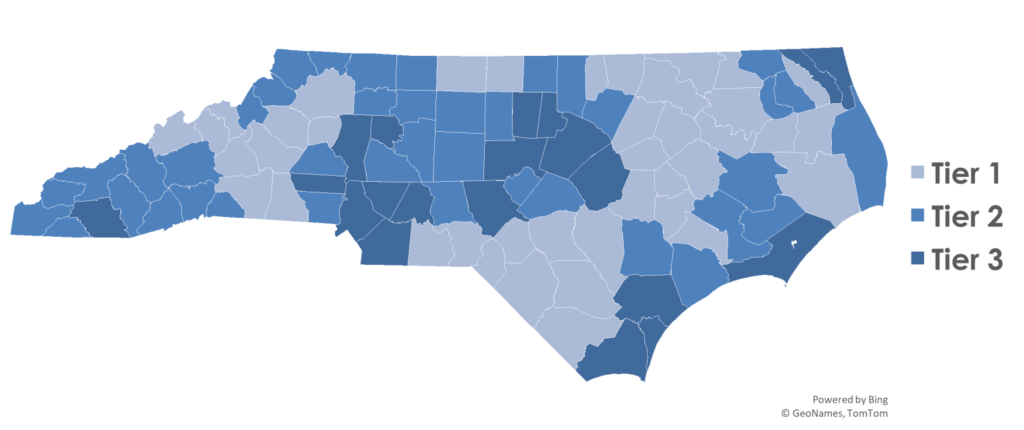
Tiers are assigned to all 100 Counties to determine various state funding opportunities that assist with economic development. For 2026, Wilkes will remain a Tier 1 ‘Most Distressed.’ Being a Tier 1 gives us the ability to request the most assistance in state incentives and grants. Since we remained a Tier 1, the question is, did we improve or decline? We improved rank in all categories. We still have a lot of work to do in relation to the North Carolina averages. Our overall Economic Distress rank significantly declined from #26 to #16 out of 100 counties, where one is the ‘most distressed’ and 100 is the ‘least distressed’.
Note: Wilkes County’s Average Annual Wage improved 7% to $50,246 which is $1.63 more per hour
| Adjusted Property Tax Base Per Capita: Tax base increased 9.79% allowing more infrastructure and public service revenue. Ranking improved from 24 to 25. | 2025 – 2026 $112,432 (#25) *NC average $177,658 | 2024 – 2025 $101,935 (#24) | 2023 – 2024 $96,295 (#30) | 2022 – 2023 $91,928 (#28) | 2021 – 2022 $90,091 (#35) | 2020 – 2021 $83,712 (#35) |
| Population Growth: % of population growth improved. Ranking changed from 28 to 31. | 7/2021 – 7/2024 1.28% (#31) *NC average 3.7% | 7/2020 – 7/2023 0.33% (#28) | 2019 – 2022 -0.75% (#29) | 2018 – 2021 -0.85% (#27) | 2017 – 2020 -1.56% (#28) | 2016 – 2019 0.29% (#30) |
| Median Household Income: Income increased. Rank improved from 15 to 20. | 2022 – 2023 $50,848 (#20) *NC average $70,838 | 2021 – 2022 $48,229 (#15) | 2020 – 2021 $47,891 (#31) | 2019 – 2020 $46,830 (#29) | 2018 – 2019 $45,250 (#27) | 2017 – 2018 $44,080 (#40) |
| Unemployment Rate, 12 Month Avg: Unemployment percentage improved from 37 to 41. | 11/2024 – 10/2025 3.81% (#41) *NC average is 3.69% | 2023 – 2024 3.94% (#37) | 2022 – 2023 3.68% (#41) | 2021 – 2022 3.70% (#47) | 2020 – 2021 4.90% (#56) | 2019 – 2020 5.99% (#64) |
Visit the NC Commerce website to learn more about the County Distress Rankings (Tiers)
County Distress Rankings (Tiers) | NC Commerce